A convenient web-based investment monitoring & analytics platform specifically tailored for impact investors. The solution serves as the link between investors and fund managers, facilitating request for measurable data on each investment as well as providing dashboards to analyze impact results. Lionwood.software team worked on coding the front-end part and refactoring the legacy back-end for better performance and scalability.

Node.js

React

TypeScript
BlueMark is a global provider of independent impact verification and intelligence for the sustainable and impact investing market. Their mission is to strengthen trust and transparency by means of verification services, benchmarking, and analytics – providing information about how investors manage and report the beneficial impact of their investments. Since 2020, BlueMark has completed hundreds of verifications, now streamlining the access to their work through the BlueMark IQ platform: a solution that helps asset managers, allocators, and other stakeholders understand, compare, and communicate impact performance.

Impact investing is notorious for its reliance on data that is often difficult to acquire or even quantify in the first place. Since its 2020 launch, BlueMark has provided investors with data and insights from its verification engagements to help them benchmark and manage their impact with greater confidence. Through the BlueMark IQ platform, BlueMark aimed to provide investors with additional support related to data collection, analysis and reporting on impact performance alongside its market insights.
Develop a comprehensive platform that streamlines requests for impact investment data
Structure data requests leveraging standardized metrics catalogs
Provide a simple yet robust architecture to handle the data securely and efficiently
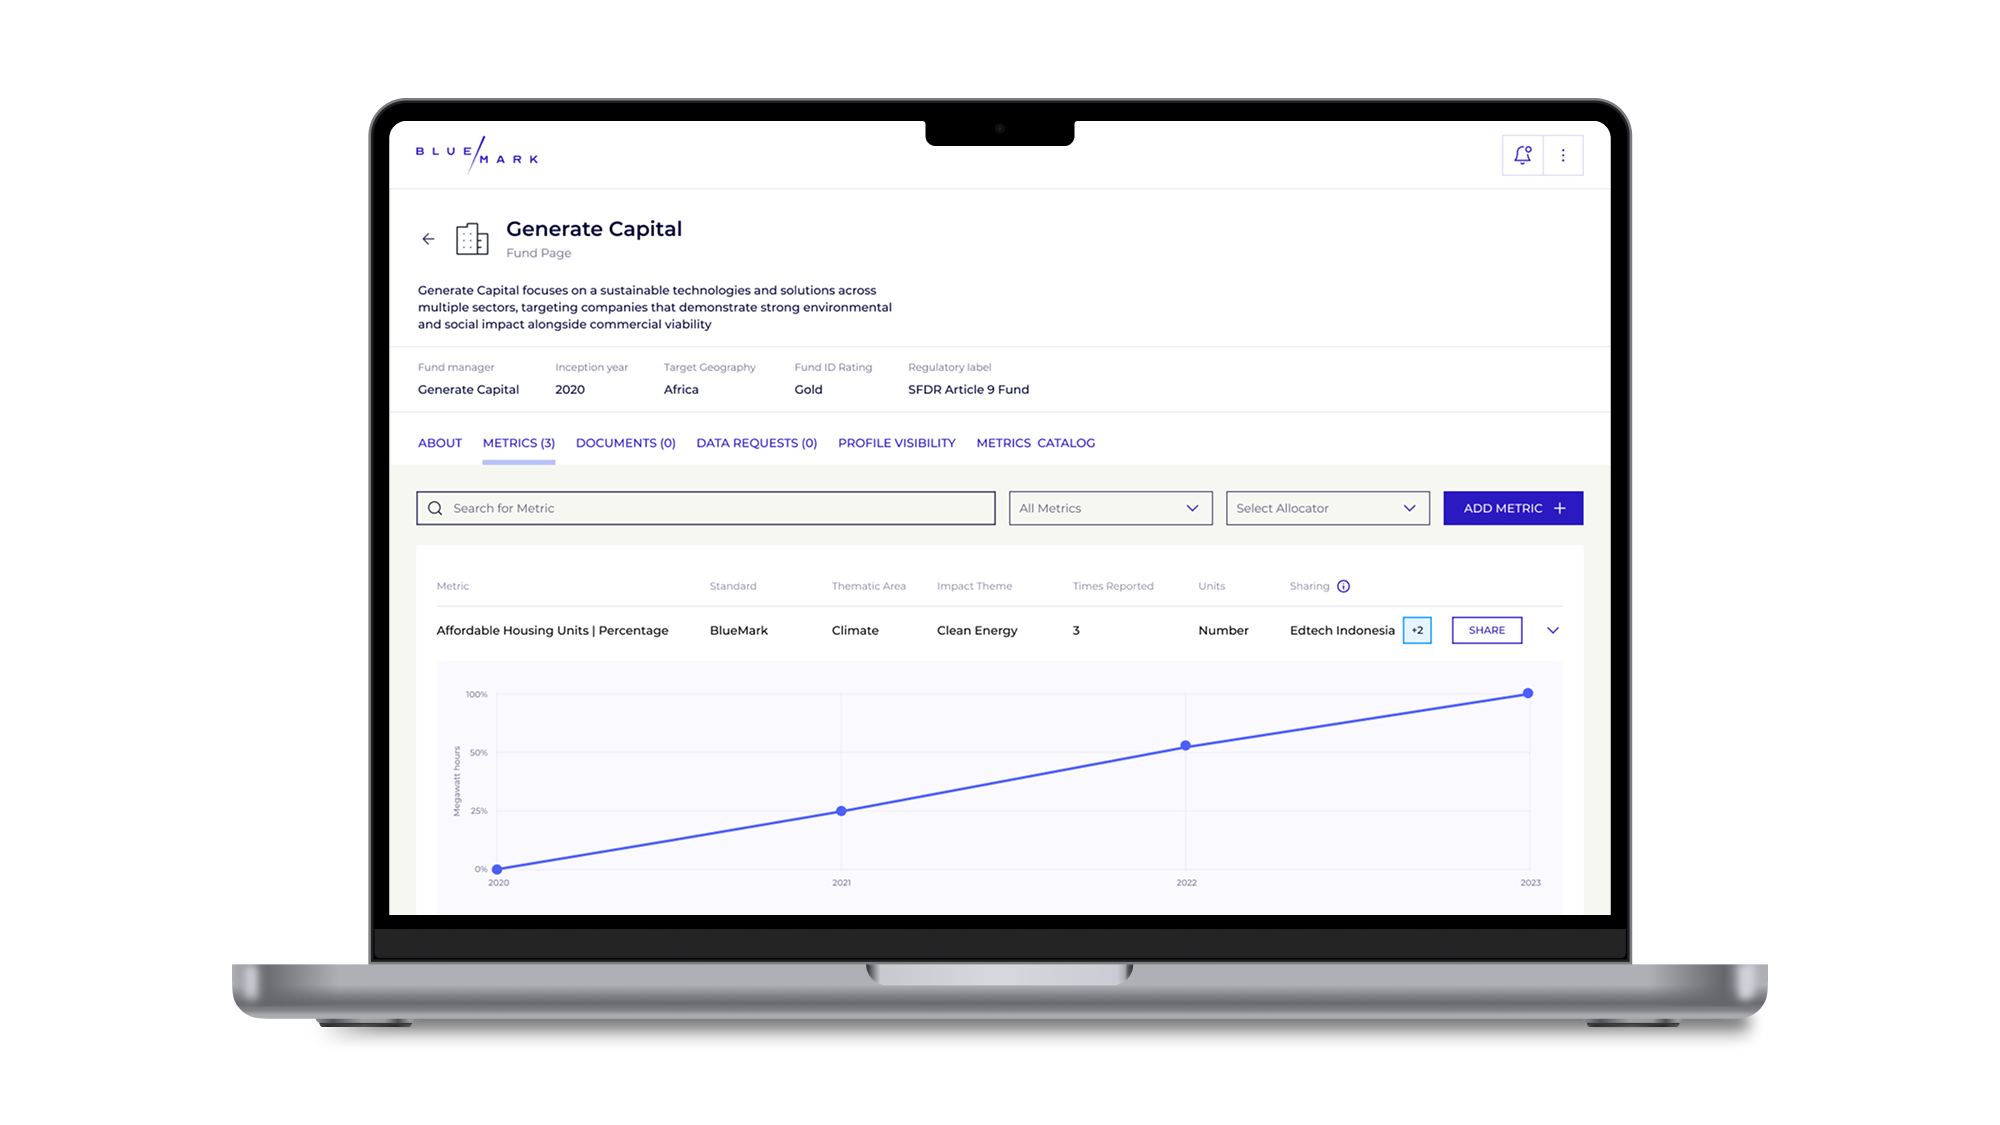
Support analysis of portfolio data with filters and graphics
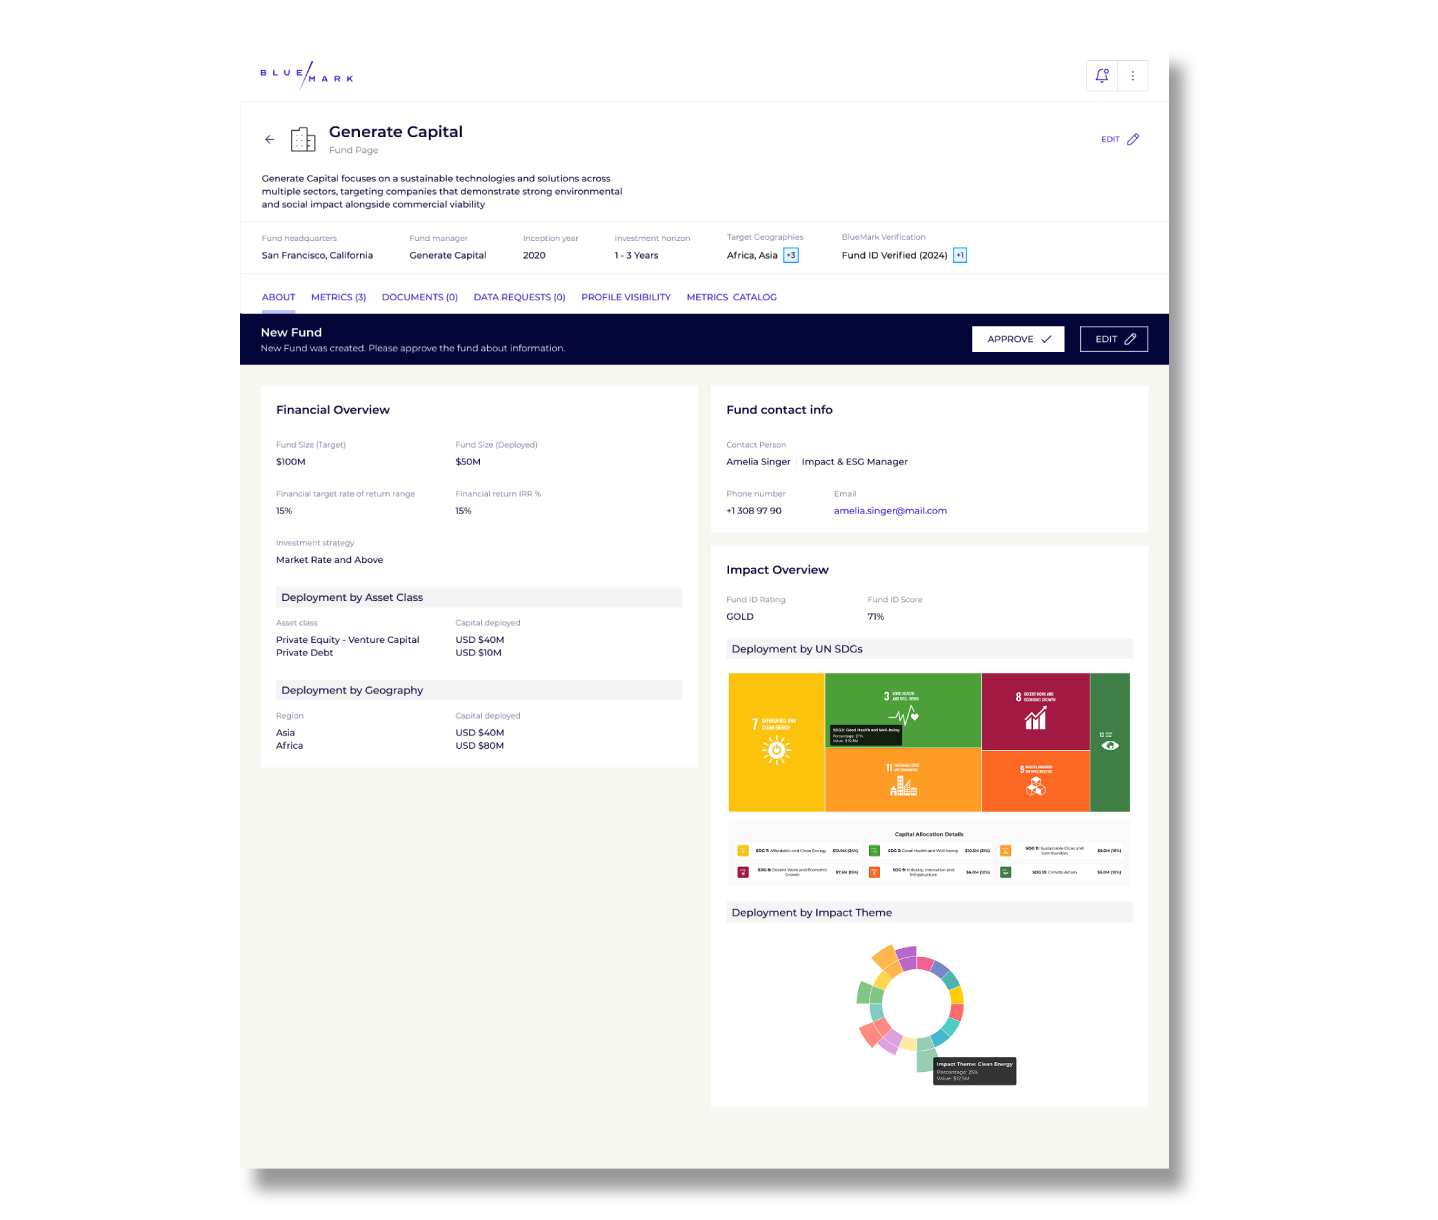
The resulting solution is a convenient, robust web-based platform that offers a fund directory, monitoring, portfolio review, and client management functionalities. Investments can be sorted and filtered by status, impact theme, asset type, and geography. There is a clear display for requests that are waiting for approval. The metrics to display are configurable within the system, while data visualization tools provide easy access and analysis of the data.